Is the Simcoe County market starting to favour buyers, or are sellers still holding their ground? September’s numbers do not give us one simple answer.

Compared with September 2025, there were fewer active listings in four of the five local markets we track. Sales increased in Springwater, remained unchanged in Essa, and declined in Barrie, Innisfil, and Oro-Medonte. Average sale prices were also lower in four markets, with Barrie as the only community to record a year-over-year increase.

For buyers and sellers, the main takeaway is that this remains a very local market. Conditions can look quite different from one community to the next, and inventory alone does not tell the whole story. Price, presentation, property type, and recent comparable sales all matter when deciding how to move forward this October.


Information provided by Toronto Regional Real Estate Board. September 2026 compared with September 2025. Figures shown reflect detached-home activity. Average sale price can vary based on the size, location, condition, features, and price range of homes sold during the reporting period.

What stands out in September’s market numbers?

September delivered a mixed set of results across the region. Barrie had fewer active listings and fewer sales than one year earlier, but its average sale price increased by 2.2%. Springwater also had fewer listings, while sales increased by 28.0% and the average price declined by 16.1%.

Essa was the only market with more active inventory than last September. Its sales count was unchanged, while its average sale price was lower. Innisfil and Oro-Medonte both recorded declines in inventory, sales, and average price.

The numbers reinforce why it is important to look beyond a regional headline. Each community is moving at its own pace, and the mix of homes sold can have a noticeable effect on monthly averages.

Are buyers still active across the region?

Yes, but activity varied considerably by location. Springwater recorded 32 sales, up from 25 last September, while Essa held steady at 18 sales. Barrie, Innisfil, and Oro-Medonte all had fewer completed transactions than they did one year ago.

That does not mean buyers have stepped away from the market. It does mean that sellers need to understand what buyers are comparing their home against. A property that is well prepared, realistically priced, and clearly positioned can still stand out, even when overall activity is uneven.

Does lower inventory give sellers an advantage?

Not automatically. Active inventory was lower in Barrie, Innisfil, Oro-Medonte, and Springwater, which means buyers had fewer available listings to choose from than they did last September. Essa moved in the opposite direction, with active inventory rising by 17.8%.

Fewer competing listings can help a well-positioned property attract attention, but lower inventory did not lead to higher average prices in most of these markets. Sellers still need to price according to current conditions and recent comparable sales rather than assuming that limited selection will support a higher asking price.

Are home prices rising or falling?

Barrie was the only market in this comparison where the average sale price increased year-over-year, rising 2.2% to $789,940. Average prices declined by 4.2% in Innisfil, 14.1% in Oro-Medonte, 16.1% in Springwater, and 27.8% in Essa.

Those changes should be read carefully. Average sale price is influenced by the types of homes that happened to sell during the month. This can create larger percentage swings in communities with fewer monthly transactions, especially when the mix includes homes from very different price ranges.

A year-over-year change in the monthly average does not mean that every property gained or lost the same amount. A current market evaluation should look at recent sales involving homes that are genuinely comparable in location, size, condition, and features.

What does this mean if you are buying or selling in October?

For sellers, the September numbers make preparation especially important. Lower inventory may reduce the number of competing listings in some communities, but buyers still have clear price expectations. Thoughtful preparation, strong photography, and a realistic launch price can make a meaningful difference.

For buyers, softer average prices in four of the five markets may create opportunities, but the right approach will depend on the specific property and neighbourhood. With fewer listings available in most communities, it helps to have financing arranged, know your priorities, and be ready when a suitable home appears.

Bottom Line

September’s numbers point to an uneven market rather than a clear advantage for either buyers or sellers. Inventory was lower in most communities, sales results were mixed, and average prices moved in different directions depending on location.

That is why local context matters. Barrie, Essa, Innisfil, Oro-Medonte, and Springwater each have their own market conditions, and broad regional trends cannot replace a closer look at the neighbourhood, property type, price range, and recent comparable sales.

For a closer look at a specific community, explore our September market updates for Barrie, Essa, Innisfil, Oro-Medonte, and Springwater.

Thinking about buying or selling in Barrie, Essa, Innisfil, Oro-Medonte, Springwater, or the surrounding Simcoe County area this October?

Connect with the Hocking Homes Team for a local, strategy-focused conversation about your next move.
Request a home valuation
Search homes for sale

We make it happen… You make it home!

...

Barrie buyers had fewer homes to choose from than they did one year ago, but that did not lead to more sales. So, what does that tell us about the market heading into October?

September’s year-over-year numbers show a quieter Barrie real estate market. Active inventory fell by 12.0%, while the number of homes sold declined by 28.2%. At the same time, the average sale price increased by 2.2% to $789,940.

For buyers and sellers, this creates a more nuanced market than the price increase alone might suggest. Fewer sales point to a slower pace, while the lower number of active listings means buyers also have less selection. The right strategy depends on the property, neighbourhood, price range, and how the home compares with recent local sales.

Information provided by Toronto Regional Real Estate Board. September 2026 compared with September 2025. Figures shown reflect detached-home activity. Average sale price can vary based on the size, location, condition, features, and price range of homes sold during the reporting period.

What is happening in the Barrie real estate market this October?

Barrie reported 522 active listings, 84 sales, and an average sale price of $789,940 in September. Compared with September 2025, there were fewer homes available and fewer completed transactions, while the average price was slightly higher.

Compared with August, inventory remained relatively steady, increasing from 517 to 522 active listings. Sales declined from 108 to 84, while the average sale price rose from $740,325 to $789,940. Together, these figures show that fewer transactions were completed in September, even as the mix of homes sold produced a higher monthly average price.

Are buyers still active in Barrie?

Yes, but fewer transactions were completed than one year ago. Barrie recorded 84 sales in September, compared with 117 in September 2025. That represents a year-over-year decline of 28.2%.

For sellers, this means it is important to understand what buyers are comparing your home against. Buyers may still act when a property fits their needs and feels appropriately priced, but not every listing will receive the same level of attention.

For buyers, fewer completed sales do not necessarily mean every property will face the same level of competition. Inventory was also lower than it was last September, so selection can still be limited within specific neighbourhoods and price ranges.

What does lower inventory mean for Barrie sellers?

Barrie had 522 active listings in September, down from 593 one year earlier. With fewer homes on the market, a well-prepared property may have less direct competition than it would have faced last September.

Lower inventory does not automatically give every seller an advantage, especially when sales have also declined. Buyers still have clear expectations around value, condition, and presentation. A realistic asking price and a strong launch strategy remain important.

Are Barrie home prices increasing?

Barrie’s average sale price reached $789,940 in September, up 2.2% from $773,272 in September 2025. Barrie was the only one of the five local markets in our comparison to record a year-over-year increase in average price.

That does not mean every Barrie property increased in value by 2.2%. A monthly average can move depending on the mix of homes sold, including their size, location, condition, features, and price range. The most useful comparison for an individual property is still based on recent sales of genuinely similar homes.

What does this mean if you are buying or selling in October?

For sellers, September’s numbers reinforce the importance of getting the details right before listing. Fewer active listings may help a well-positioned home stand out, but the decline in sales means pricing and presentation still need to align with current buyer expectations.

For buyers, fewer completed sales do not automatically make every purchase easier. Conditions will vary by neighbourhood and price point, and the best-positioned homes may still attract attention. With fewer homes available than last year, it is helpful to have financing in place and know which features matter most before the right opportunity appears.

Bottom Line

Barrie’s September numbers point to a market with fewer available listings and fewer completed sales, even as the average sale price finished slightly higher than last year.

Heading into October, buyers and sellers should look beyond the citywide average. Conditions can vary significantly between neighbourhoods, property types, and price ranges, making recent local comparisons an important part of any buying or selling decision.

Thinking about buying or selling in Barrie this October?

Connect with the Hocking Homes Team for a local, strategy-focused conversation about your next move.
Request a home valuation
View Barrie homes for sale

We make it happen… You make it home!
...

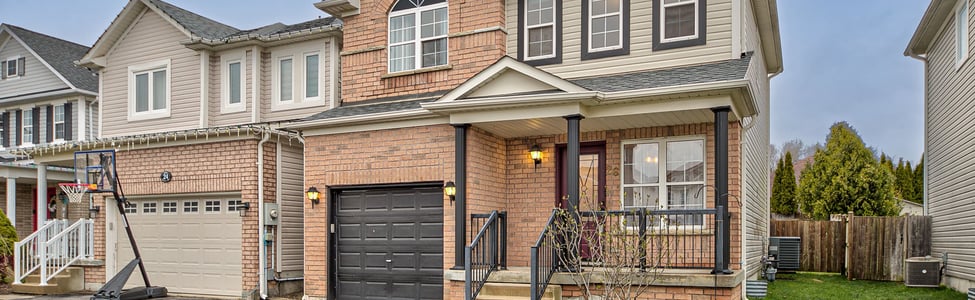
Essa had more homes on the market than it did one year ago, but exactly the same number of sales. What does that mean for buyers and sellers heading into October?

September’s year-over-year numbers show active inventory rising by 17.8%, from 101 to 119 listings. Sales held steady at 18, while the average sale price declined by 27.8% to $788,444.

For buyers, the increase in available homes means more choice than last September. For sellers, steady sales alongside higher inventory make pricing and presentation especially important. The large change in average price also needs context because Essa’s relatively small number of monthly sales can cause the average to shift noticeably depending on which properties sold.

Information provided by Toronto Regional Real Estate Board. September 2026 compared with September 2025. Figures shown reflect detached-home activity. Average sale price can vary based on the size, location, condition, features, and price range of homes sold during the reporting period.

What is happening in the Essa real estate market this October?

Essa reported 119 active listings, 18 sales, and an average sale price of $788,444 in September. Compared with September 2025, there were more homes available, the same number of completed sales, and a lower average sale price.

The changes from August were much smaller. Active listings increased from 114 to 119, sales moved from 19 to 18, and the average sale price declined from $804,521 to $788,444.

At first glance, these numbers may seem to pull in different directions. Buyers had more listings to consider, but the number of sales remained unchanged from last year. For sellers, that means there is still activity in the market, but there is also more competition for buyers’ attention.

Are buyers still active in Essa?

Yes. Essa recorded 18 sales in September, exactly matching the number completed in September 2025. Buyer activity did not increase year-over-year, but it did not decline either.

The difference is that buyers had more homes to choose from. With 119 active listings compared with 101 last September, sellers need to give buyers a clear reason to choose their property. Appropriate pricing, thoughtful preparation, and strong presentation can all help a home stand out.

What does higher inventory mean for Essa sellers?

Active inventory increased by 17.8% year-over-year, making Essa the only one of the five local markets in our comparison to report more available listings than last September.

More inventory means buyers can compare a wider range of homes before making a decision. A property that is priced well and presented properly can still attract attention, but pricing based on older market conditions may make it harder to compete with current listings.

What does the change in Essa’s average sale price mean?

Essa’s average sale price was $788,444 in September, down 27.8% from $1,091,751 in September 2025. It was also slightly lower than August’s average of $804,521.

This does not mean every Essa home lost 27.8% of its value. With only 18 sales in each September comparison, differences in the size, location, condition, features, and price range of the homes sold can have a substantial effect on the monthly average.

For an individual property, recent sales of similar homes in the same part of Essa will usually provide a much clearer picture of current value than the municipality-wide average alone.

What does this mean if you are buying or selling in October?

For sellers, the increase in inventory makes a strong first impression especially important. Buyers have more homes to compare than they did last September, so the asking price, condition, photography, and overall presentation need to work together from the beginning.

For buyers, more inventory provides more options, but each property still needs to be assessed on its own merits. Looking at recent comparable sales and understanding the differences between Angus, Thornton, and Essa’s rural areas can help you make a more informed decision.

Bottom Line

Essa’s September numbers show more active inventory, unchanged year-over-year sales, and a lower average sale price. Buyers had more listings to choose from, while sellers faced more competition for the same number of completed sales.

The sharp year-over-year price change needs to be viewed in the context of Essa’s smaller monthly sales count and the mix of properties sold. Heading into October, current local comparisons will provide a clearer picture than the municipal average alone.

Thinking about buying or selling in Essa this October?

Connect with the Hocking Homes Team for a local, strategy-focused conversation about your next move.
Request a home valuation
View Essa homes for sale

We make it happen… You make it home!
...

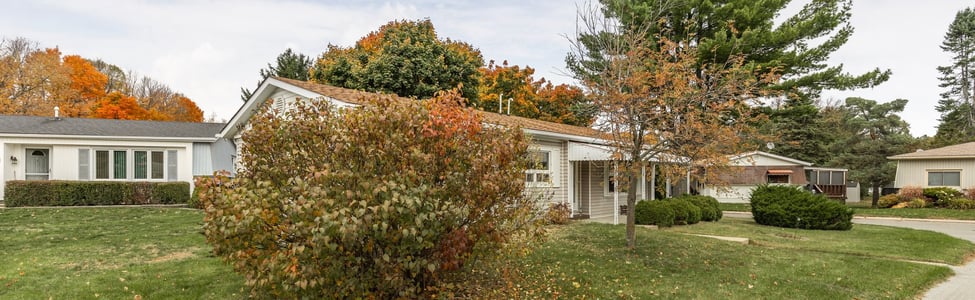
Innisfil had fewer active listings and fewer sales than it did one year ago, while the average sale price also eased. Does that make October easier for buyers? Not necessarily.

September’s year-over-year numbers show active inventory declining by 15.8%, from 392 to 330 listings. Sales fell by 13.5%, from 52 to 45, while the average sale price declined by 4.2% to $777,023.

For buyers, softer pricing may create opportunities, but lower inventory also means less selection than last September. For sellers, fewer available homes can reduce direct competition, although the decline in sales means pricing and presentation still need to reflect current market conditions.

Information provided by Toronto Regional Real Estate Board. September 2026 compared with September 2025. Figures shown reflect detached-home activity. Average sale price can vary based on the size, location, condition, features, and price range of homes sold during the reporting period.

What is happening in the Innisfil real estate market this October?

Innisfil reported 330 active listings, 45 sales, and an average sale price of $777,023 in September. All three measures were lower than they were in September 2025.

The changes from August were smaller. Active listings declined from 345 to 330, sales edged up from 44 to 45, and the average sale price moved down from $795,975 to $777,023.

September was fairly steady compared with August, but the year-over-year picture was softer. Fewer homes were available, fewer transactions were completed, and the average price finished modestly lower than it did last September.

Are buyers still active in Innisfil?

Yes. Innisfil recorded 45 sales in September, one more than in August. However, that was still seven fewer sales than the 52 completed in September 2025.

Homes are still selling, but September finished with seven fewer sales than the same month last year. For sellers, that makes it important to understand which comparable homes are attracting buyers and which listings are being overlooked.

What does lower inventory mean for Innisfil?

Active inventory fell from 392 listings in September 2025 to 330 in September 2026. Buyers therefore had fewer available homes to choose from than they did one year earlier.

For sellers, lower inventory can mean fewer competing listings, but it does not guarantee a quick sale or a higher price. Sales were also down year-over-year, so buyers may still compare value carefully before making a decision.

For buyers, selection may vary considerably depending on the neighbourhood, property type, and price range. Even with fewer sales overall, a well-priced home in a sought-after area can still attract attention.

Are Innisfil home prices changing?

Innisfil’s average sale price was $777,023 in September, down 4.2% from $810,724 in September 2025. It was also 2.4% lower than August’s average of $795,975.

This does not mean every Innisfil home declined in value by the same amount. The monthly average is influenced by the mix of homes sold, including their size, location, condition, features, and price range.

For an individual property, recent sales of comparable homes in the same area will provide a more useful picture than the municipality-wide average on its own.

What does this mean if you are buying or selling in October?

For sellers, lower inventory may help a well-positioned home stand out, but the decline in year-over-year sales means strategy still matters. Pricing, preparation, photography, and how the home compares with nearby listings can all affect the result.

For buyers, the softer average price may be encouraging, but fewer active listings can limit the available choices. Having financing arranged and knowing your preferred neighbourhoods and priorities can help when the right home comes to market.

Bottom Line

Innisfil’s September numbers show fewer active listings, fewer year-over-year sales, and a moderately lower average sale price. The market was relatively steady compared with August, but September’s activity remained below the same month last year.

Heading into October, buyers and sellers should look closely at current conditions within the specific neighbourhood and price range that matters to them. Innisfil includes a wide range of properties and communities, so local comparisons remain essential.

Thinking about buying or selling in Innisfil this October?

Connect with the Hocking Homes Team for a local, strategy-focused conversation about your next move.
Request a home valuation
View Innisfil homes for sale

We make it happen… You make it home!
...

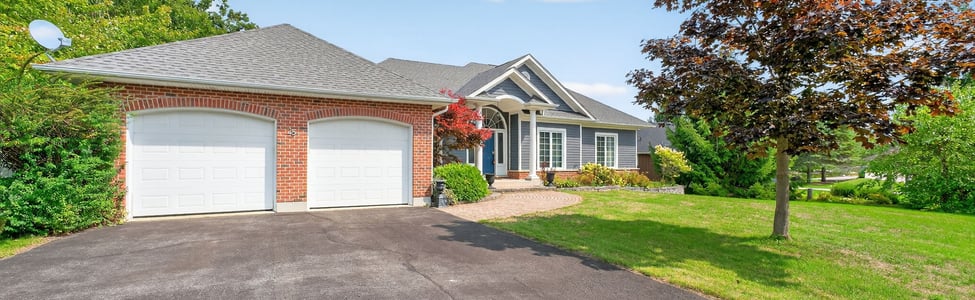
Oro-Medonte had almost as many active listings as it did last September, but only about half as many sales. What does that mean for buyers and sellers heading into October?

September’s year-over-year numbers show active inventory declining by 5.4%, from 184 to 174 listings. Sales fell by 48.7%, from 39 to 20, while the average sale price declined by 14.1% to $894,945.

For sellers, the sharp drop in completed sales makes pricing and presentation especially important. For buyers, fewer transactions do not automatically mean that every property presents the same opportunity. Oro-Medonte includes a wide range of homes, locations, lot sizes, and price points, so the details behind each listing still matter.

Information provided by Toronto Regional Real Estate Board. September 2026 compared with September 2025. Figures shown reflect detached-home activity. Average sale price can vary based on the size, location, condition, features, and price range of homes sold during the reporting period.

What is happening in the Oro-Medonte real estate market this October?

Oro-Medonte reported 174 active listings, 20 sales, and an average sale price of $894,945 in September. All three measures were lower than they were in September 2025, although the decline in sales was much larger than the change in active inventory.

Compared with August, active listings increased slightly from 172 to 174. Sales declined from 23 to 20, while the average sale price moved down from $948,978 to $894,945.

The clearest takeaway is that fewer transactions were completed. Inventory remained fairly close to last year’s level, but September finished with 19 fewer sales than the same month in 2025.

Are buyers still active in Oro-Medonte?

Yes, but at a slower pace. Oro-Medonte recorded 20 sales in September, compared with 39 one year earlier. Sales were also slightly lower than the 23 completed in August.

Homes are still selling, but the lower transaction count means sellers should pay close attention to recent comparable sales and current competition. Buyers may be drawn to different features depending on whether they are looking for a rural property, an estate home, a waterfront setting, or something closer to Barrie or Orillia.

What does the inventory picture mean for Oro-Medonte sellers?

Active inventory declined from 184 listings in September 2025 to 174 in September 2026. That is a relatively modest change compared with the much larger decline in sales.

For sellers, this means there were nearly as many available listings competing for fewer completed transactions. A property still needs to be positioned carefully, with a price that reflects its location, condition, features, and the most relevant recent sales.

Oro-Medonte is not a one-size-fits-all market. Two homes can have very different values depending on acreage, waterfront access, outbuildings, renovations, and proximity to local amenities. Broad municipal averages are helpful for context, but they cannot replace a property-specific comparison.

What does the change in Oro-Medonte’s average sale price mean?

Oro-Medonte’s average sale price was $894,945 in September, down 14.1% from $1,042,302 in September 2025. It was also 5.7% lower than August’s average of $948,978.

This does not mean every Oro-Medonte property declined in value by 14.1%. With only 20 sales recorded in September, differences in the size, location, condition, features, and price range of the homes sold can have a noticeable effect on the monthly average.

For an individual home, the most useful comparison will come from recent sales of properties with genuinely similar characteristics.

What does this mean if you are buying or selling in October?

For sellers, September’s lower sales count reinforces the importance of launching with the right strategy. With nearly as many active listings as last year but fewer completed sales, a home that is difficult to compare or priced above current expectations may have more difficulty attracting attention.

For buyers, the lower average price and slower sales activity may create opportunities, but every property should be evaluated individually. Condition, acreage, location, services, and unique features can all have a significant effect on value in Oro-Medonte.

Bottom Line

Oro-Medonte’s September numbers show slightly lower inventory, significantly fewer sales, and a lower average sale price than one year ago. The largest change was in the number of completed transactions, which fell from 39 to 20.

Heading into October, buyers and sellers should look beyond the municipal average and focus on the part of Oro-Medonte that matters to them. Recent comparable sales and the specific features of the property will provide the clearest guide.

Thinking about buying or selling in Oro-Medonte this October?

Connect with the Hocking Homes Team for a local, strategy-focused conversation about your next move.
Request a home valuation
View Oro-Medonte homes for sale

We make it happen… You make it home!

...

Springwater recorded more sales than it did one year ago, even with fewer homes on the market. At the same time, the average sale price moved lower. What does that mean heading into October?

September’s year-over-year numbers show active inventory declining by 19.3%, from 192 to 155 listings. Sales increased by 28.0%, from 25 to 32, while the average sale price declined by 16.1% to $987,483.

For sellers, more completed sales and fewer competing listings are encouraging signs. The lower average price needs to be viewed separately because it may reflect the mix of homes sold rather than a uniform change in property values.

Information provided by Toronto Regional Real Estate Board. September 2026 compared with September 2025. Figures shown reflect detached-home activity. Average sale price can vary based on the size, location, condition, features, and price range of homes sold during the reporting period.

What is happening in the Springwater real estate market this October?

Springwater reported 155 active listings, 32 sales, and an average sale price of $987,483 in September. Compared with September 2025, there were fewer homes available, more completed sales, and a lower average sale price.

The changes from August tell a similar story. Active listings declined from 167 to 155, while sales increased from 22 to 32. The average sale price moved down from $1,061,427 in August to $987,483 in September.

More homes changed hands in September, but the homes that sold produced a lower average price. That combination is a good reminder that sales activity and average price do not always move in the same direction.

Are buyers still active in Springwater?

Yes. Springwater recorded 32 sales in September, up from 25 in September 2025 and 22 in August 2026. Of the five local markets in our comparison, Springwater had the largest year-over-year percentage increase in sales.

That does not mean every listing will attract the same interest. Buyers are comparing location, condition, lot size, finishes, and price. A home that fits current expectations can still stand out, particularly when there are fewer active listings to compete with.

What does lower inventory mean for Springwater sellers?

Active inventory declined from 192 listings in September 2025 to 155 in September 2026. Springwater therefore had 37 fewer available listings than it did one year earlier.

For sellers, fewer competing listings can help a well-positioned home attract attention. However, the lower average sale price means it is still important to price according to current comparable sales rather than relying on last year’s expectations.

Springwater includes very different communities and property types. Market conditions for a home in Midhurst may not look the same as they do in Elmvale, Minesing, or a rural part of the township. The most relevant comparisons will usually come from nearby properties with similar characteristics.

What does the change in Springwater’s average sale price mean?

Springwater’s average sale price was $987,483 in September, down 16.1% from $1,177,368 in September 2025. It was also 7.0% lower than August’s average of $1,061,427.

This does not mean every Springwater property declined in value by 16.1%. With 32 sales recorded in September, differences in the size, location, condition, features, and price range of the homes sold can have a meaningful effect on the monthly average.

For an individual home, recent sales of genuinely comparable properties will provide a clearer view of current market value than the township-wide average alone.

What does this mean if you are buying or selling in October?

For sellers, September’s higher sales count shows that transactions are happening, while lower inventory may reduce direct competition. Even so, the asking price, preparation, photography, and overall presentation still need to reflect what buyers are seeing elsewhere in the market.

For buyers, September’s lower average is worth noting, but it should not be treated as a blanket price reduction across Springwater. Fewer active listings can also mean less choice in a preferred community or price range. It helps to have financing arranged and a clear understanding of which features matter most before the right property appears.

Bottom Line

Springwater’s September numbers show fewer active listings, more completed sales, and a lower average sale price than one year ago. More homes changed hands despite buyers having fewer available listings to choose from.

Heading into October, buyers and sellers should look beyond the township-wide average. Springwater’s communities and property types can perform differently, making current local comparisons especially important.

Thinking about buying or selling in Springwater this October?

Connect with the Hocking Homes Team for a local, strategy-focused conversation about your next move.
Request a home valuation
View Springwater homes for sale

We make it happen… You make it home!

...
1
2
3
...
8